Client Overview
A textile manufacturing unit operating in India runs 3 production shifts daily with over 15 weaving and dyeing machines.
The team relied on data from Excel logs, PLC sensors, and manual shift records to monitor performance.

A textile manufacturing unit operating in India runs 3 production shifts daily with over 15 weaving and dyeing machines.
The team relied on data from Excel logs, PLC sensors, and manual shift records to monitor performance.
The factory faced frequent production delays and uneven machine utilization across shifts. Management had little real-time insight into machine performance, making it difficult to understand downtime reasons or shift efficiency.
Problems included inconsistent logging practices, reliance on guesswork for decisions, and no visibility into OEE (Overall Equipment Effectiveness).
Recurring machine failures went unnoticed, and performance varied without clear accountability.
The goal was to develop a Power BI dashboard that would provide:
To address the visibility gap in production and downtime, Ghanshyam Data Tech designed a Power BI dashboard that brought together data from multiple sources, including Excel-based downtime logs and sensor-generated CSV files. The team standardized downtime reasons — such as mechanical failures, electrical issues, and setup delays — to ensure consistent reporting. Machine-level data was mapped and transformed using Power Query, allowing for accurate aggregation and analysis.
The dashboard incorporated key performance metrics like Availability, Performance, Quality, and Overall Equipment Effectiveness (OEE), along with supporting KPIs such as shift-wise production summaries, downtime frequency per machine, and Mean Time Between Failures (MTBF). The interface provided clear visualizations including trend lines for OEE, downtime breakdowns by reason code, shift comparison charts, and machine utilization heatmaps. Interactive filters made it easy for users to explore performance by shift, machine, or product type — enabling teams to quickly identify issues and take action.
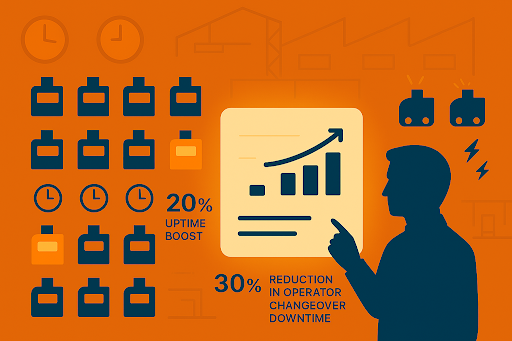
Within just six weeks of implementing the Power BI dashboard, the manufacturing unit experienced a 20% improvement in machine uptime by identifying and addressing the most frequent downtime causes. Shift managers began making real-time, data-informed decisions that directly improved productivity on the shop floor. Downtime due to operator changeovers was reduced by 30%, and maintenance teams introduced preventive strategies after spotting high-failure trends through the dashboard.
The dashboard also became a valuable tool during weekly performance reviews, fostering a culture of transparency and accountability. By combining real-time OEE tracking with machine, shift, and operator-level data, the organization was able to uncover actionable insights and optimize operations.
This case highlights how even mid-sized manufacturers can drive measurable improvements using Power BI and existing data sources. Visual analytics not only streamline reporting but also empower teams to take timely and informed actions that improve efficiency and reduce downtime.