Client Overview
A U.S.-based pharmaceutical manufacturing company operates with over 1,000 employees and serves both domestic and international markets. With an annual revenue exceeding $40 million, the organization manages financial operations using SAP ERP for transaction processing and Excel-based budgeting tools for planning and departmental cost tracking.
Business Challenge
A mid-sized pharmaceutical company based in the U.S. struggled with financial visibility and cost control. The finance team faced difficulties such as manually comparing actual expenses with monthly budgets, frequent overspending in departments like R&D and procurement, and delayed month-end reporting. These inefficiencies made financial planning reactive, not strategic.
Objective
To implement a Power BI dashboard that empowers finance teams to:
- Compare monthly and quarterly budgets against actual expenses
- Analyze spending at the department and project level
- Identify cost overruns and savings opportunities
- Enable real-time, visual reporting for finance leadership
Solution Delivered
Ghanshyam Data Tech developed a customized Power BI dashboard by integrating financial data from SAP ERP with Excel-based departmental budget files. The dashboard provided real-time comparisons of actual spending against budget allocations, enabling finance teams to monitor performance on a monthly and quarterly basis. With built-in variance calculations and intuitive filters by department and cost center, the dashboard made it easy to identify overspending and track deviations from planned budgets.
Key performance indicators such as total budget, total actuals, variance percentages, and overspending alerts were all powered by DAX formulas, providing finance leaders with actionable insights at their fingertips. This interactive solution was actively used during leadership and compliance reviews to support more agile financial decision-making.
Achieved Results & Strategic Insights
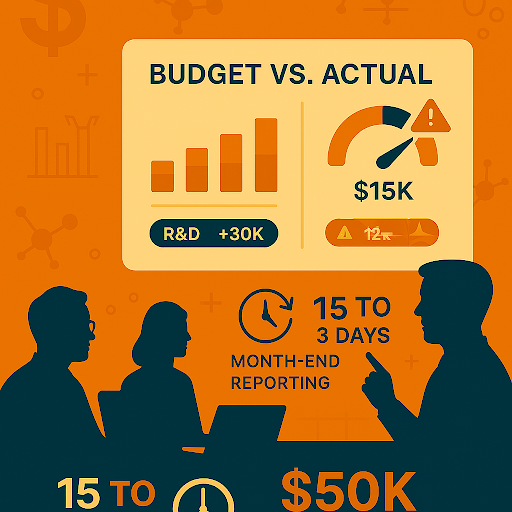
Within just two months of deploying the Power BI dashboard, the pharmaceutical company significantly improved its financial reporting efficiency — reducing the month-end reporting cycle from 15 days to just 3. The solution enabled early detection of $15,000 in logistics overspending and helped uncover over $50,000 in potential savings by optimizing administrative and travel-related expenses. With these actionable insights, finance leaders began using the dashboard live during boardroom discussions, making data-driven decisions faster and with greater confidence.
This implementation demonstrated that real-time dashboards can greatly accelerate decision-making, improve budget compliance, and highlight spending trends across departments. For mid-sized pharmaceutical organizations, Power BI proved to be a scalable and cost-effective solution that transformed traditional reporting into a proactive financial management tool.

