
Introduction
Insurance companies process thousands of claims across health, motor, property, and life insurance. Managing these claims efficiently while identifying potentially fraudulent activities is an important business challenge.
Duplicate submissions, exaggerated losses, and suspicious claim patterns can lead to financial losses and operational risks.
Insurance claims analytics helps organizations identify unusual activities, monitor claim patterns, and improve decision-making. With Microsoft Power BI, companies can transform complex claims data into interactive dashboards that support better visibility, risk monitoring, and investigation processes.
Why Insurance Fraud Detection Matters
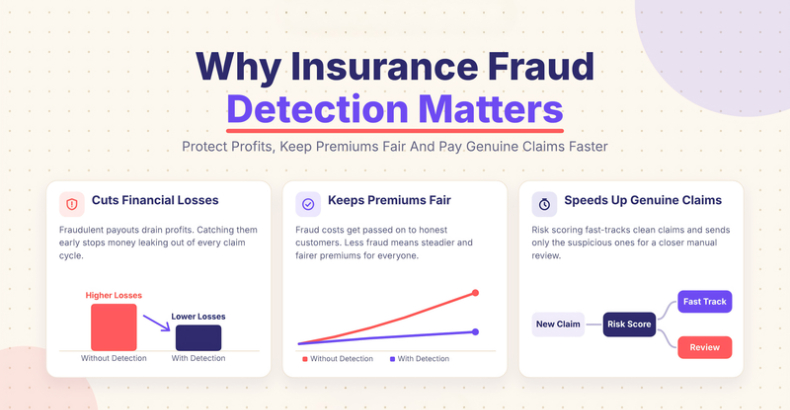
Insurance fraud affects both insurers and genuine policyholders. When fraudulent claims go undetected, companies may face unnecessary payouts, increased investigation costs, and higher operational risks.
Some common types of insurance fraud include
Duplicate Claims: Submitting multiple claims for the same incident or expense.
Exaggerated Claims: Reporting higher losses or damages than actually occurred.
False Documentation: Providing misleading invoices, medical records, or accident reports.
Suspicious Claim Patterns: Repeated claims involving similar customers, vehicles, providers, or incidents.
Unusual Payment Activities: Identifying payment requests that differ significantly from normal claim behavior.
Identifying these activities early helps insurance companies prioritize suspicious cases and allocate investigation resources more effectively.
How Data Analytics Helps Detect Insurance Fraud
Data analytics enables insurance companies to examine historical and current claims data to identify patterns that may require further investigation.
By combining information from policy management systems, claims platforms, customer databases, and payment records, organizations can develop a more complete view of claim activity.
Analytics can help insurers:
- Identify duplicate or unusually frequent claims.
- Compare claim amounts against historical trends.
- Detects unusual patterns across customers, locations, and service providers.
- Monitor claim processing times and payment activities.
- Prioritize claims that require additional investigation.
These insights do not automatically confirm fraud. Instead, they help investigation teams identify potential warning signs and decide which claims need closer review.
Using Power BI for Insurance Claims Analytics
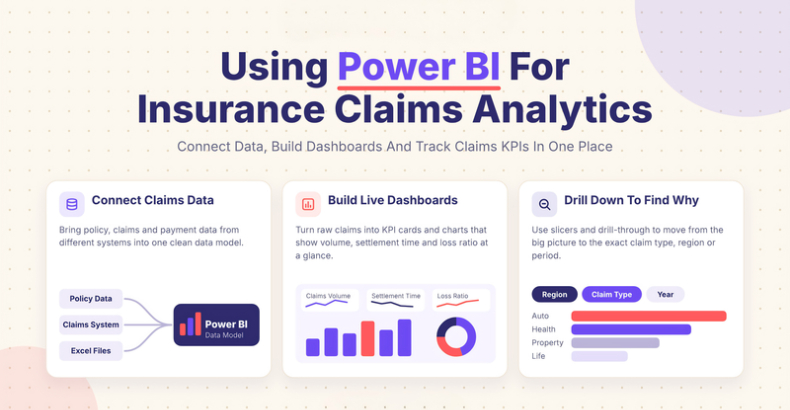
Microsoft Power BI helps insurance organizations convert complex claims data into meaningful visual insights. It connects data from multiple sources, supports data modeling, and presents important information through interactive dashboards and reports.
With Power BI, insurance teams can monitor claim performance, compare trends, and investigate unusual activities from a centralized reporting environment.
1. Claims Overview Dashboard
A claims overview dashboard provides a summary of insurance operations and helps management understand overall claim performance.
It can display:
- Total claims received and processed.
- Approved, rejected, and pending claims.
- Total claim amounts and payouts.
- Average claim processing time.
- Claims by insurance type and region.
This visibility helps management identify operational trends and areas that require attention.
2. Suspicious Claims Monitoring
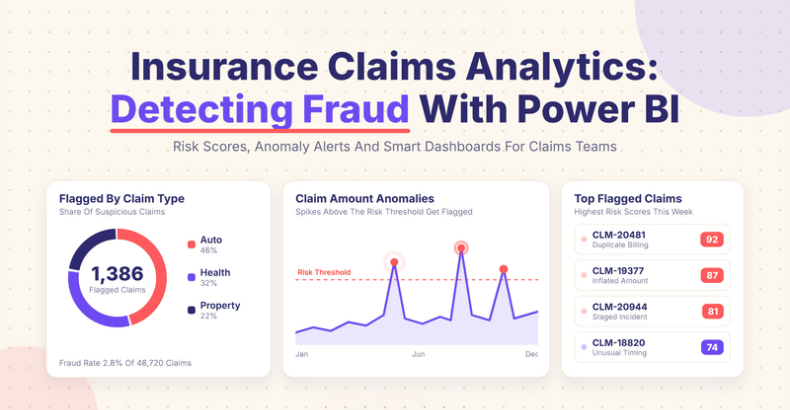
Power BI dashboards can highlight claims that match predefined risk indicators, such as repeated submissions, unusually high claim amounts, or multiple claims associated with the same customer or service provider.
Conditional formatting, filters, and drill-through reports allow investigation teams to examine suspicious records in greater detail.
For example, if a particular provider submits an unusually high number of claims compared with historical patterns, analysts can review the associated records and investigate the reason.
3. Claim Pattern and Trend Analysis
Historical claims data can reveal patterns that may not be visible through individual claim reviews.
Power BI helps analysts compare claim frequency, payout amounts, rejection rates, and regional trends over different periods. These insights can help identify unusual changes in claim activity and support better risk monitoring.
4. Investigation Performance Tracking
Fraud investigation teams also need visibility into their own performance.
Power BI can help track:
- Number of claims flagged for investigation.
- Cases under review and completed investigations.
- Average investigation turnaround time.
- The metrics include confirmed fraud cases and the estimated financial exposure associated with them.
- Recovery amounts from identified fraudulent claims.
These metrics help organizations understand investigation workloads and evaluate the effectiveness of their review processes.
Key Metrics to Monitor in Insurance Claims Analytics
Power BI dashboards can help insurance organizations monitor important business metrics, including:
- Total Claims Received and Processed
- Claim Approval and Rejection Rates
- Average Claim Amount
- Average Claim Processing Time
- Suspicious Claims Identified
- Claims Under Investigation
- Estimated Fraud Exposure
- Fraud Recovery Amount
Tracking these metrics helps management understand claims performance, monitor potential risks, and improve operational efficiency.
The Role of AI and Advanced Analytics in Fraud Detection

Power BI provides reporting and visualization capabilities, while advanced analytics and machine learning can help identify more complex fraud patterns.
AI models can analyze historical claims data to identify unusual combinations of customer behavior, claim frequency, transaction amounts, and other risk indicators.
For example, a machine learning model may assign a risk score to a claim based on patterns learned from historical data. Power BI can then visualize these scores, helping investigation teams prioritize cases for review.
However, risk scores should not be treated as proof of fraud. Human investigation, appropriate validation, and clear decision-making controls remain essential.
Best Practices for Implementing Insurance Claims Analytics
To build an effective insurance claims analytics solution, organizations should focus on data quality, reliable reporting, and responsible fraud investigation practices.
Some important considerations include:
Integrate Data Sources: Bring together relevant claims, policy, customer, and payment information.
Maintain Data Quality: Identify missing records, duplicate entries, and inconsistent information.
Define Risk Indicators: Establish clear rules and criteria for identifying unusual claim activity.
Protect Sensitive Information: Apply role-based access controls and appropriate data security measures.
Monitor Dashboard Accuracy: Regularly validate reports, calculations, and underlying data.
Review Flagged Claims: Ensure that suspicious activities are assessed by qualified investigation teams before decisions are made.
These practices help insurers build a reliable analytics environment that supports fraud monitoring and operational improvement.
Conclusion
Insurance claims analytics enables organizations to move beyond manual claim reviews and gain better visibility into suspicious activities and operational trends.
Using Microsoft Power BI, insurance companies can transform claims data into meaningful insights, monitor key business metrics, and support investigation teams in prioritizing potentially fraudulent cases.
By combining business intelligence and advanced analytics, organizations can strengthen fraud monitoring, improve operational efficiency, and make more informed business decisions.
FAQs
Insurance claims analytics uses data to monitor claim performance, identify unusual patterns, and detect potential fraud.
Power BI dashboards highlight suspicious claims, duplicate submissions, unusual payouts, and abnormal claim patterns.
Duplicate claims, exaggerated losses, false documentation, unusual payment requests, and repeated suspicious claim patterns.
Key metrics include total claims, approval rates, average claim amounts, suspicious claims, investigation time, and fraud recovery amounts.
AI analyzes historical claims data to identify complex patterns and assign risk scores to claims for further investigation.