BI Without Borders: Building Multi-Region Dashboards for Global Teams
In today’s globalized business landscape, data doesn’t sleep—and neither do the teams that depend on it. As organizations expand across time zones, languages, and cultures, the need for multi-region business intelligence (BI) dashboards has never been greater. This new frontier of BI, often referred to as “BI Without Borders,” is about more than just scaling dashboards—it’s about breaking silos, ensuring data consistency, and delivering insights in context for global decision-makers.
So, how do you build dashboards that work seamlessly across borders?
Why Global Dashboards Matter
Traditional dashboards are often siloed within regions or departments. But for multinational teams, this creates serious gaps:
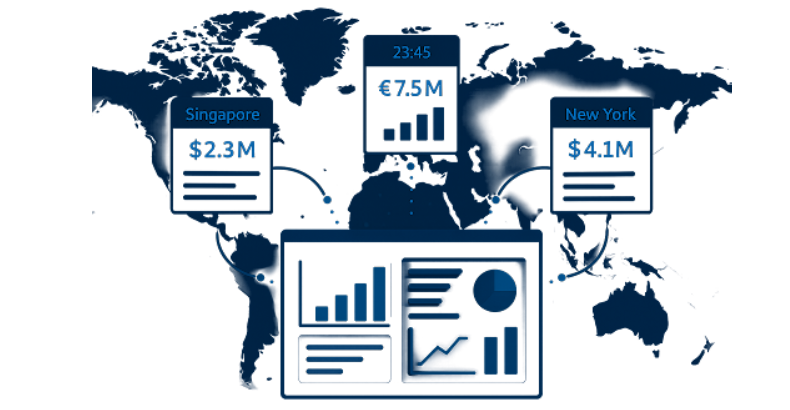
- A sales director in Singapore needs to compare regional performance with Europe.
- A product team in Berlin wants to analyze user behavior across LATAM and APAC.
- A CFO in New York must monitor consolidated revenue and forecast variance across all business units.
Global dashboards bring these perspectives into one unified, live reporting layer, offering a single source of truth that helps everyone—from analysts to executives—stay on the same page.

The Building Blocks of Multi-Region BI
Creating a truly multi-region dashboard requires more than translating labels. You need to design for data variety, regional compliance, and user relevance.

Here are the core components to consider:
- Regional Data Modeling: Each region might store data in different formats, currencies, or systems. Building a common data model with regional fact and dimension tables ensures flexibility while maintaining consistency.
- Localization: Go beyond translation. Consider date formats (DD/MM vs MM/DD), currencies, languages, and number separators. Power BI, for example, supports dynamic formatting based on user locale settings.
- Time Zone Awareness: A KPI may look different in Tokyo at 9 AM than it does in San Francisco. Time zone normalization allows dashboards to reflect data accurately based on the viewer’s local time.

- Row-Level Security (RLS): Global dashboards need to enforce region-based access control. RLS ensures users only see the data relevant to their region or role, while central leadership can view the entire picture.

Best Practices for Building Multi-Region Dashboards
To create a seamless, user-friendly experience for your global teams, consider these key best practices:
- Design for Scale, Not Just Speed: Design your data pipelines and reports to handle growth across regions and business lines. Use tools like Dataflows, Fabric, or Azure Synapse for scalable architecture.

- Dynamic Filtering & Slicers: Enable users to filter by country, region, or business unit dynamically. You can use parameterized queries or bookmarks to personalize views.
- Use Power BI Deployment Pipelines: Separate your dev, test, and production workspaces by region or function to support agile development without disrupting global reporting.
- Include Global and Regional Views: Offer a bird’s-eye overview with drill-through capabilities into regional specifics—giving execs both macro and micro insights in one place.
- Feedback Loops & Iteration: Global teams use dashboards differently. Build in feedback loops via Power BI comments or Teams integration to continuously refine usability and insights.
Real Impact: Global Alignment in Action
Let’s say a company operates in 10+ countries across 3 continents. Before implementing a global BI dashboard, each regional team worked in silos, using their own Excel sheets or reports. After transitioning to a unified Power BI solution:
- Reporting time dropped by 60%
- Decision-makers gained cross-market visibility
- Data governance improved through centralized controls
- Collaboration across teams increased measurably
This isn’t just about better visuals—it’s about enabling faster, more confident decision-making at scale.
Conclusion: Breaking Borders, Connecting Insights
In a digital-first, borderless world, data must follow suit. Building multi-region BI dashboards is not just a technical achievement—it’s a strategic enabler of collaboration, trust, and alignment across your global workforce.
By investing in the right data infrastructure, design principles, and governance models, organizations can empower every team, anywhere in the world, to make smarter decisions—together.
This is BI Without Borders. And it’s the future of global intelligence.